


Industrial air filtration systems work quietly in the background of a plant, but their condition has a direct bearing on product quality, equipment life, and regulatory compliance. Unlike a machine breakdown, a failing filter rarely announces itself with an alarm. It degrades gradually, and by the time the effects are visible on the shop floor, the plant may already be operating with compromised air quality for weeks or months. Understanding when to replace industrial filters, and building a schedule around measurable indicators rather than guesswork, is one of the most cost-effective maintenance decisions a facility can make.
Why Filter Replacement Timing Matters
Every filter has a finite dust-holding capacity. As particulate accumulates on the filter media, two things happen simultaneously: filtration efficiency can initially improve as the dust cake helps trap finer particles, but airflow resistance rises. Once a filter passes a certain point of loading, the balance tips — airflow drops, energy consumption per unit of clean air rises, and in some filter types, particles can begin to shed back into the airstream.
Replacing filters too early wastes consumable cost. Replacing them too late strains blowers and motors, increases energy draw, and risks contaminating the very process the filtration system was installed to protect — whether that is a paint booth, a pharmaceutical cleanroom, or a food processing line. A defined replacement schedule, informed by actual operating data rather than a fixed calendar alone, addresses both risks.
Key Signs an Industrial Filter Needs Changing
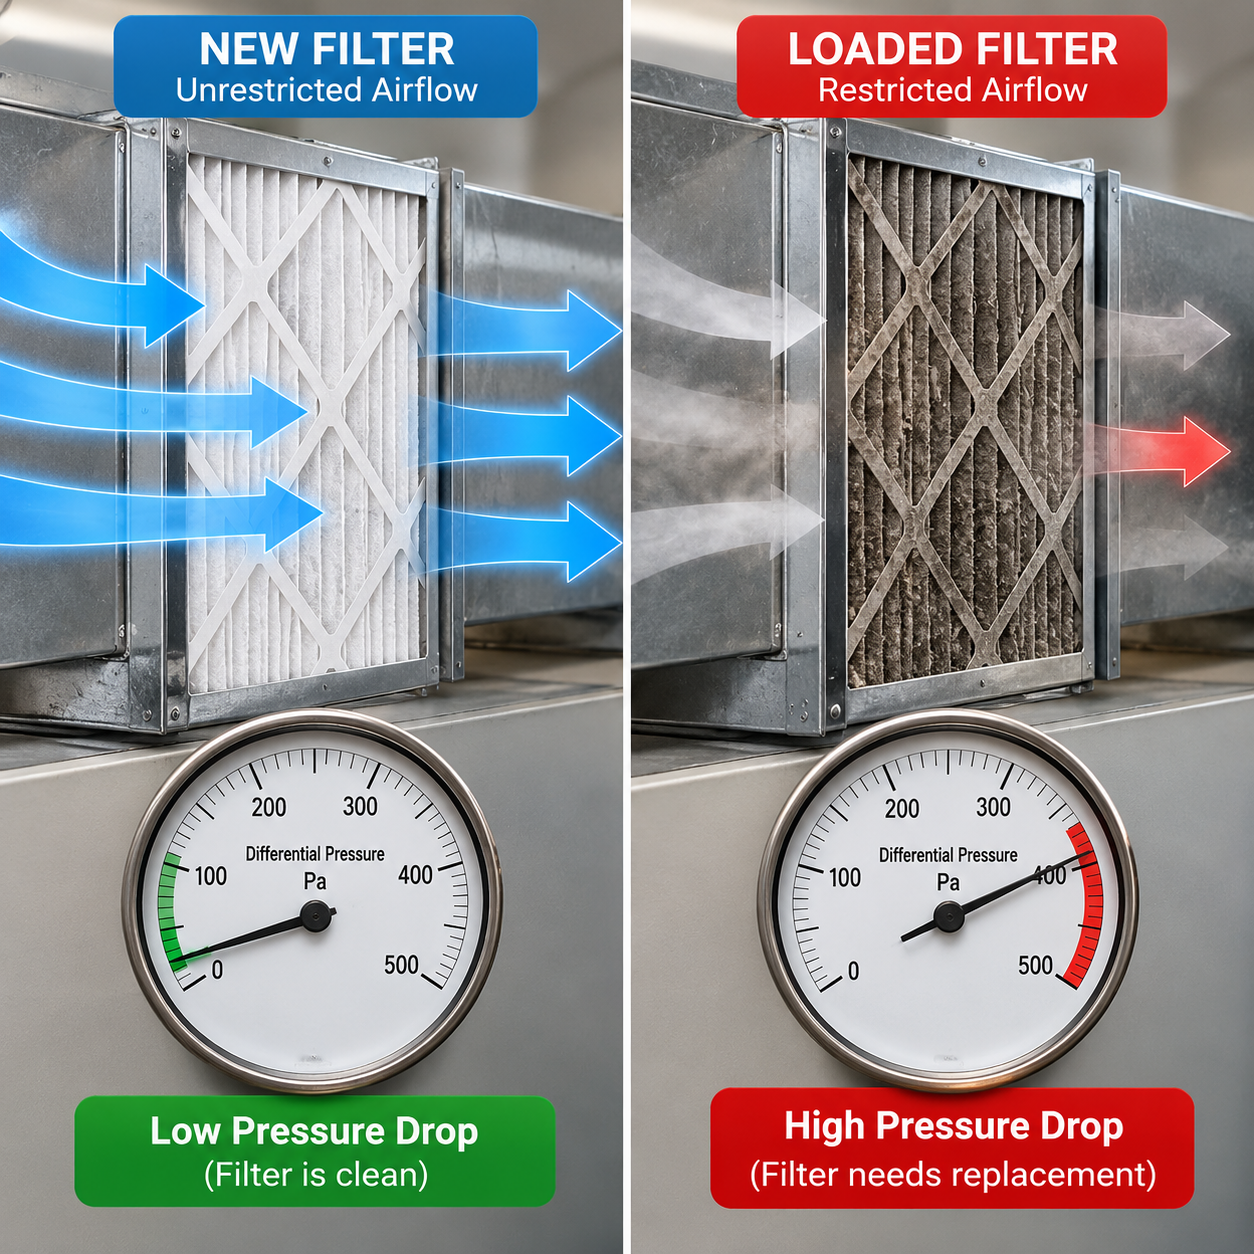
1. Rising Pressure Drop (Differential Pressure)
This is the most reliable, measurable indicator of filter condition. A magnehelic gauge or differential pressure sensor across the filter bank shows the resistance air faces passing through the media. Every filter has a manufacturer-specified initial pressure drop and a final (recommended replacement) pressure drop. When the reading approaches or exceeds the final threshold, the filter has reached the end of its effective service life, regardless of how long it has been installed.
2. Reduced Airflow or Weak Suction
If operators notice reduced air delivery at diffusers, slower dust collection at extraction points, or a general drop in system throughput, a loaded filter is often the cause. In dust collection systems, this can show up as visible dust settling in areas that were previously kept clean.
3. Increased Energy Consumption
Fans and blowers work harder to push air through a clogged filter, which shows up as a measurable rise in motor amperage or energy bills relative to baseline. Facilities that track energy-per-unit-output often catch filter degradation through this metric before it becomes visually obvious.
4. Visible Dust Buildup or Discoloration
For filters that are visually accessible, heavy discoloration, a caked appearance, or visible dust breakthrough on the downstream (clean) side are clear signs of overloading or failure.
5. Unusual Odors
A musty or stale smell from air handling units can indicate microbial growth on a moisture-laden filter, particularly in humid climates or where condensation collects near the filter housing.
6. Frequent Equipment Strain or Nuisance Shutdowns
Motors and blowers operating against high resistance for extended periods run hotter and experience more wear. Repeated thermal overload trips or unexplained motor failures are sometimes traced back to filters that were left in service well past their rated life.
7. Failed Compliance or Audit Readings
In regulated environments such as pharmaceutical manufacturing, hospital operation theatres, and food processing plants, periodic particle counts or air quality audits can flag non-conformance. A filter nearing the end of its life is a common root cause identified during these checks.
Building a Replacement Schedule
A sound schedule combines three inputs rather than relying on any single one:
- Manufacturer-rated service life as a baseline reference (varies by filter class — pre-filter, fine filter, or HEPA).
- Differential pressure monitoring, checked at a set interval (commonly weekly or monthly depending on the environment), with replacement triggered at the specified final pressure drop.
- Environmental loading factors, such as ambient dust levels, seasonal pollution spikes, humidity, and production volume, which can shorten expected filter life significantly compared to the manufacturer’s baseline assumptions.
For multi-stage systems, pre-filters typically require more frequent replacement than fine or HEPA-stage filters, since their role is to protect the downstream stages from bulk particulate load. Staggering replacement intervals by stage, rather than changing the entire bank on a single fixed date, is generally more cost-efficient and reduces unnecessary disposal of filters that still have usable life.
Documentation and Compliance
For regulated facilities, maintaining a filter replacement log — recording installation date, differential pressure readings at each check, and replacement date — supports both internal maintenance planning and external audits. This record becomes part of the evidence trail during inspections tied to standards such as GMP, HACCP, or hospital infection-control requirements.
Conclusion
Industrial filter replacement should be driven by data, not assumption. Differential pressure trends, airflow measurements, and energy consumption together provide an objective picture of when a filter has reached the end of its useful service life. Facilities that combine manufacturer guidance with routine monitoring reduce both operating costs and the risk of contamination events, while building a documented maintenance history that supports compliance requirements across pharmaceutical, food, healthcare, and general manufacturing environments.


1 Comment